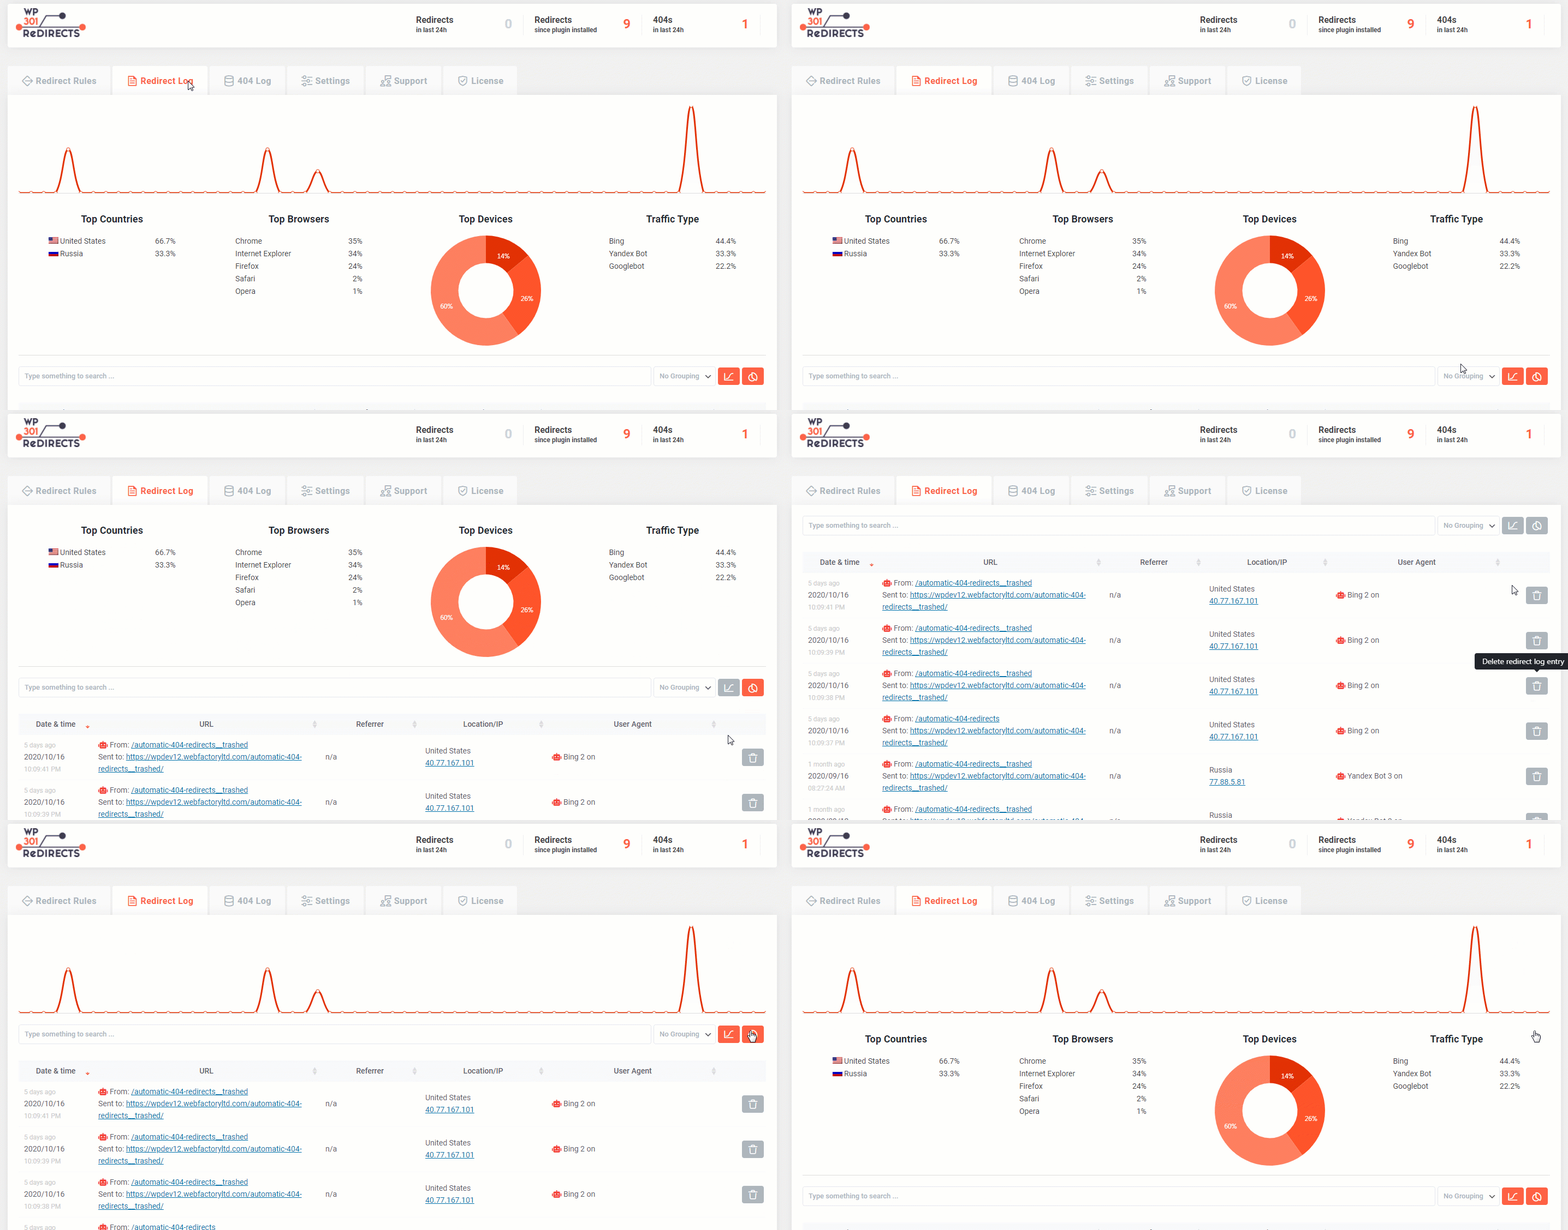
Show/Hide Graphs and Statistics
By default, WP 301 Redirects will show you a graph with detailed statistics. To analyze your Redirects and 404 Errors, open the Redirect or 404 Log from the main plugin menu.
If you do not want this information to be displayed, you can turn it off by clicking on the icons found on the right-hand side of the screen.

Group Entries
When viewing Redirect and 404 Logs, all entries are displayed by default. That means you can view all the latest statistics in chronological order.
But when you start getting more hits, logs can quickly become hard to read.
That’s why you can group entries and display them in a more neat fashion.
How to Group Entries?
- Go to Settings -> 301 Redirects
- Open Redirects or 404 Log
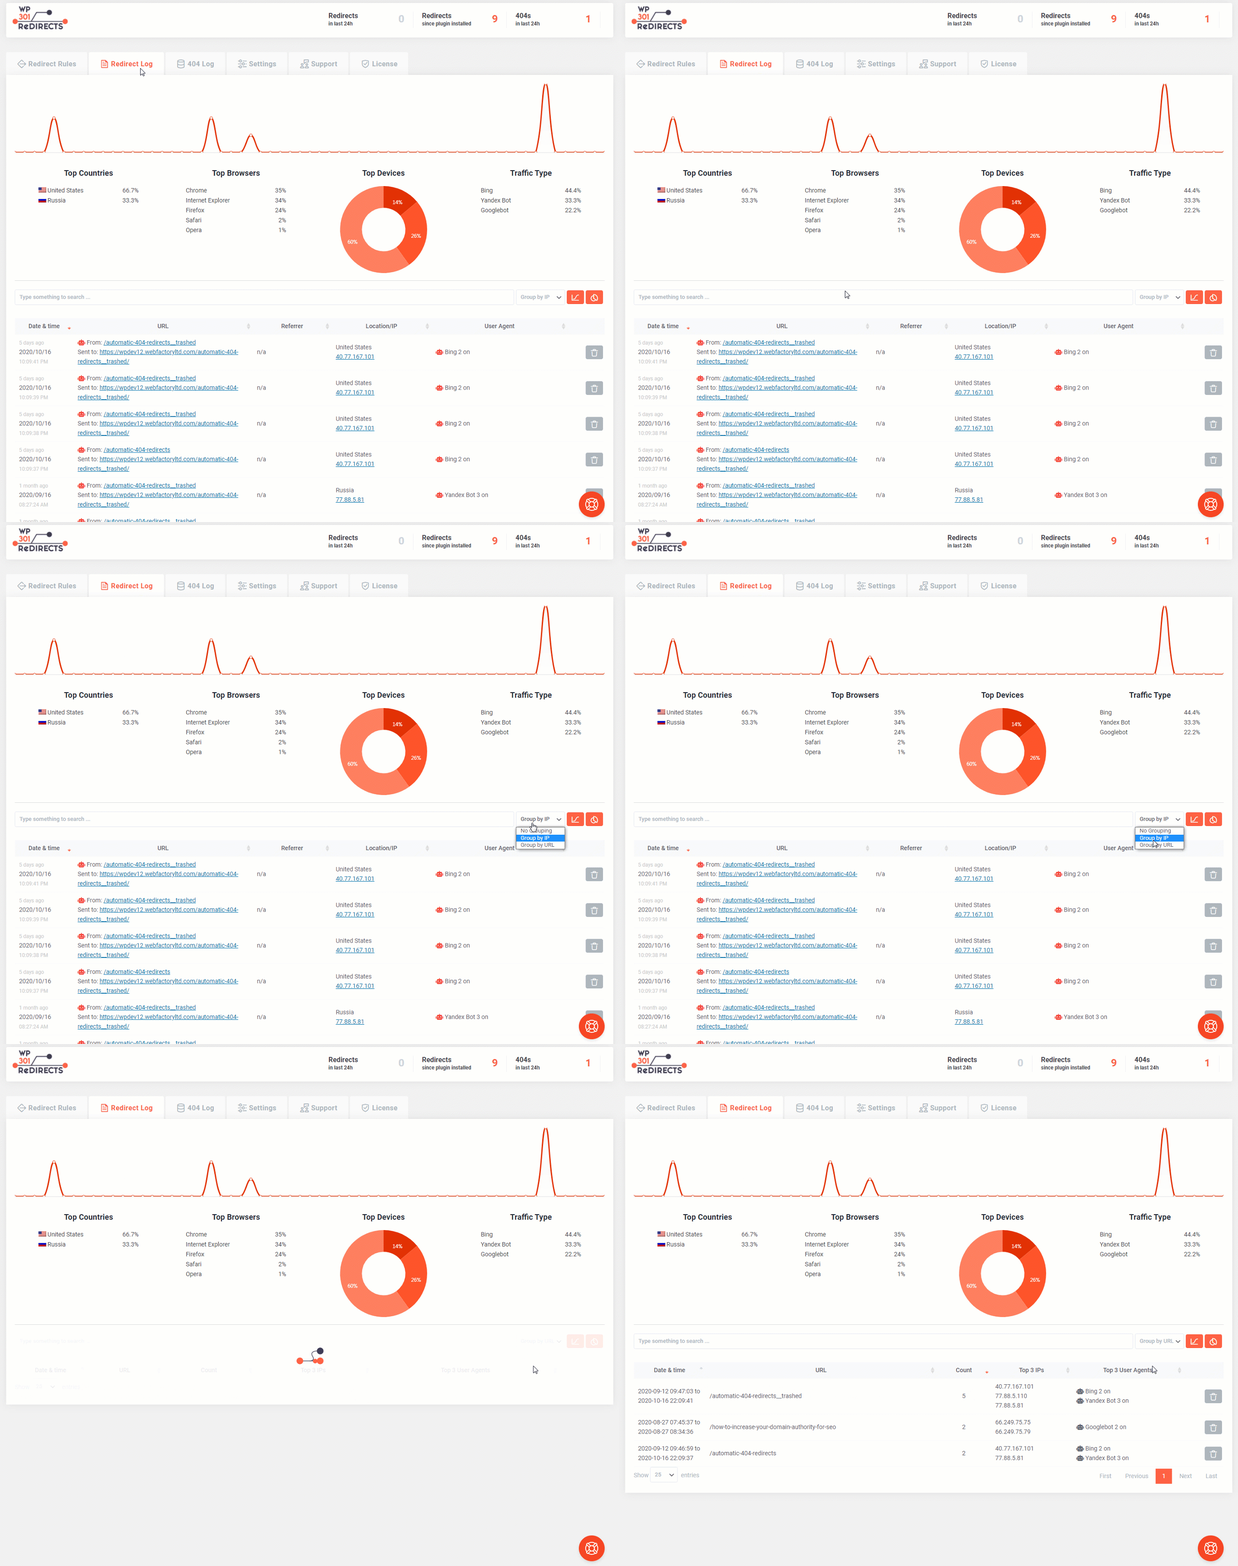
- Below the graphs, on the right side, you will see the “Group” button
Click on the drop-down menu where you can select from three different options of grouping:
- No Grouping (default)
- Group by URL
- Group by IP
After that, your entries will be grouped by URL or IP, giving you more understanding of what’s going on.
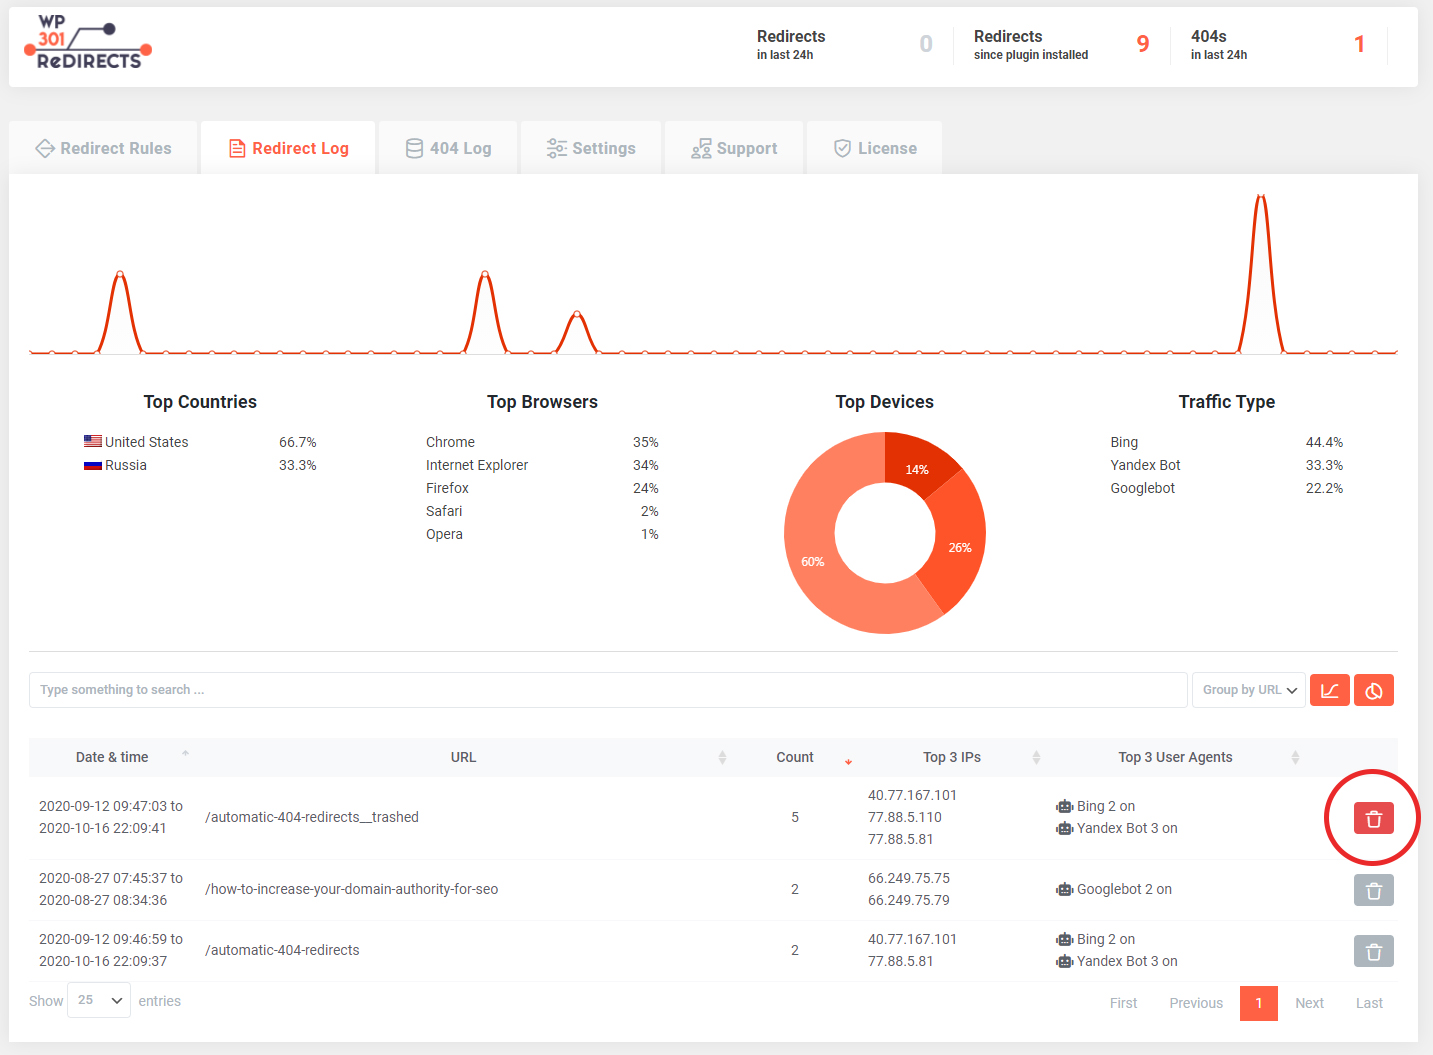
You can now easily see how many times a single redirect or 404 error has been activated. You can also see if a single source (IP) triggered multiple redirects, etc.

Delete Log Entry
If you want to delete a specific log entry, you can quickly remove it from the list:
- Go to Settings -> 301 Redirects
- Open the Redirect or 404 Log
- Find the entry on the list you wish to delete
- On the far right side of the screen, click on the trashcan icon
- Confirm you want to delete the entry

