A dashboard is essential for every department, from sales to operations, but dashboards are particularly beneficial for marketing. Numerous components, including over a dozen different internet channels and offline marketing initiatives, are necessary for the development and maintenance of a robust marketing ecosystem.
A key performance indicator (KPI) dashboard provides marketers and business executives with the information necessary to determine what is happening with the aspects of their marketing strategy that are most important, where to make adjustments if things start to go wrong, and how to identify opportunities for new initiatives that can spur even greater success.
Getting your dashboard just perfect takes some work, but the benefits are significant. Executives that can effectively implement an effective dashboard can achieve more substantial outcomes and establish a more rewarding, joyful, and experimental work environment for their teams. This environment allows for more freedom for creativity and experimentation among team members.
Your chosen key performance indicators (KPIs) must be connected to your plan and include forward-looking and retrospective elements. Although it may be tempting to include every measure that comes to mind in these reports, doing so would be a severe oversight. When faced with a mound of data, it is practically hard to give the most important figures the amount of attention they are entitled to.
What components have to be included in a KPI Dashboard?

The finest dashboards should include only five to nine key performance indicators. After all, they ought to be the critical performance metrics that form the basis of your company’s playbook.
If you aren’t sure which data points you should be focusing on, one approach to thinking about it is to ask yourself what few things would be catastrophic for your company if any of them went wrong.
From this perspective, it may be easier to differentiate between meaningless numbers, such as the amount of monthly social media impressions, and essential metrics, such as the cost-per-acquisition.
The Advantages of Using a KPI Dashboard
The ease with which KPI dashboards make it possible to monitor progress toward targets is one of its many benefits. The following are some other explanations for why you may be interested in purchasing one.
1. A Comprehensive Introduction
The viewers of a KPI dashboard are given an in-depth look at the development that a firm is making. It is feasible to organize, evaluate, and filter the most relevant data for any company by using these charts because of their very visual nature. KPI dashboards provide data in a straightforward format to comprehend, which eliminates the need to go through copious amounts of detailed data.
2. Improved Capacity for Making Decisions
If you want to be successful in business, you need to be able to make choices based on data that is both accurate and current, and KPI dashboards may assist you in doing so. Because they display all of an organization’s crucial operational data in one location, key performance indicators (KPIs) are easier to see. This tool improves analytical efficiency and the capacity to make appropriate judgments in light of the available data by doing away with data silos.
3. Analysis Done in Real-Time
KPI dashboards allow you to keep a close eye on the most critical performance data in real-time. Because of the availability of this information, decision-makers can take preventative action and achieve improved business results.
5 of the Best KPI Dashboard Programs Available to Use
Before creating a KPI dashboard, you will need to get KPI dashboard software. Here are the five that are currently considered to be the greatest.
1. Hubspot

You can easily construct visually beautiful KPI dashboards that are simple to comprehend by using the free KPI software available via Hubspot. To get an overall picture of how well your firm is doing, you may collect data from several departments using the KPI dashboard software offered by Hubspot. Because you can decide who may access your dashboards, you won’t need to be concerned about any security breaches affecting your data.
2. Geckoboard
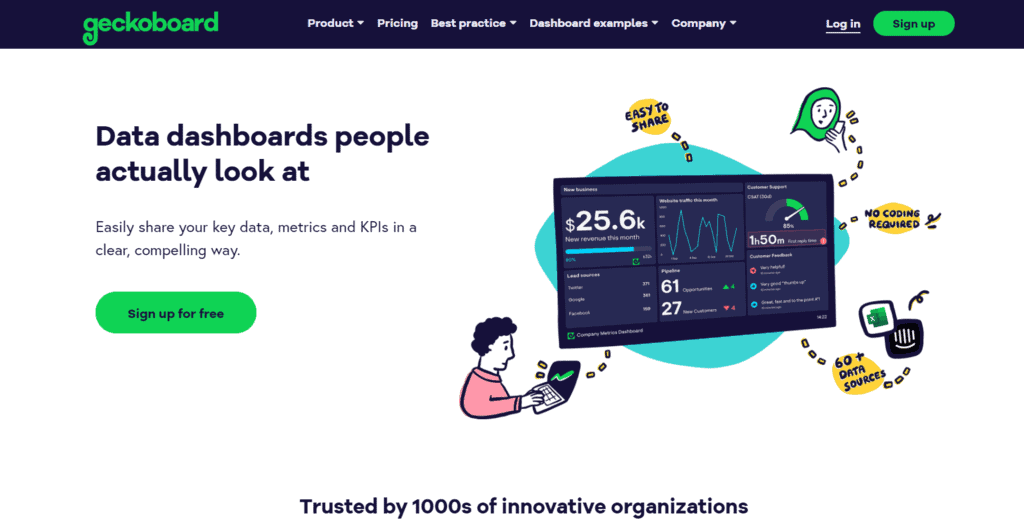
The KPI dashboard software provided by Geckoboard enables you to zero in on the indicators that are most important to your company. It is simple to construct and gives you the ability to extract data from various sources, including databases, spreadsheets, and even Zapier connections.
3. Klipfolio
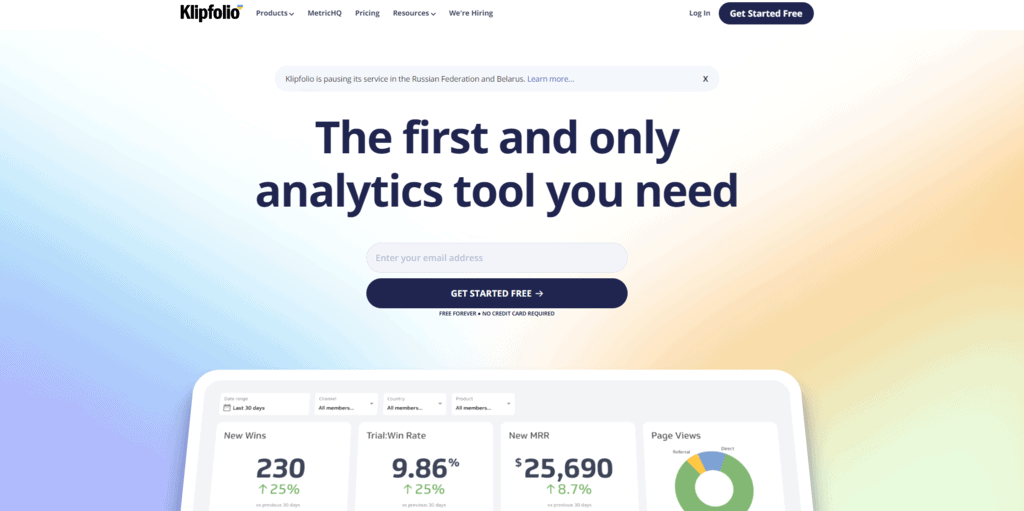
Klipfolio assists business owners in visualizing their data, which enables them to have a better understanding of how well their company is operating and make more educated choices about its future. In addition, Kilpfolio maintains historical data, allowing business owners to evaluate their company’s progress across various time frames.
4. Databox

Databox, much like Geckoboard, compiles information from a variety of sources to assist teams in tracking trends, improving collaboration, and making more educated choices that contribute to the growth of businesses.
You can rapidly learn how to utilize Databox to develop excellent KPI dashboards, even if you have no prior experience with coding whatsoever. You can also quickly link Databox to other platforms to capture additional data, which is made possible by its over 70 connections.
5. Zoho

Another excellent business intelligence (BI) and analytics tool at your disposal are Zoho, which you can use to build KPI dashboards. Thanks to the drag-and-drop dashboard builder, you should have no trouble navigating the platform, even if you have never used it before. It is also possible to view the report you make on Zoho from your mobile devices, such as smartphones and tablets, making it a mobile-friendly platform.
After you have decided on the software you want to use, the following are some of the most helpful recommendations and best practices that will assist you in developing a great KPI dashboard.
Conclusion
The first thing you need to do is figure out what your goals are for your company. The next step is to choose key performance indicators (KPIs) from this list that illustrate those goals and how close you are to achieving them. The next thing you need to do is choose the data sources you will make use of. Decide where your data will be based on the KPIs you have defined.
The final stage is to centralize all collected data into a single location using Whatagraph. The next step is to construct your digital marketing dashboard using drag-and-drop widgets or by selecting a template from our collection or one that is recommended in this tutorial. Lastly, demonstrate your marketing plan’s success by displaying it on a marketing performance dashboard designed just for professionals.