Load testing looks simple at first. You run a test. You watch results. Then memory spikes, tests slow down, or JMeter crashes. This usually points to garbage collection behavior, not to JMeter bugs.
This article explains how garbage collection works in JMeter, why it matters, and how you can configure it the right way without guessing.
If you run JMeter for long tests or high load, this guide is for you.
What Is JMeter and How It Uses Memory?
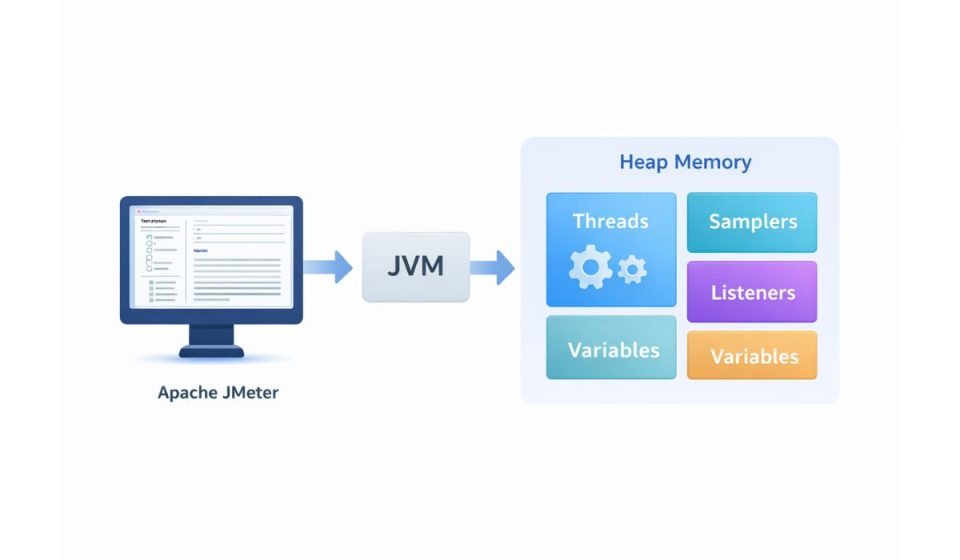
Apache JMeter is a load testing application built on Java. Because of that, it runs inside the Java Virtual Machine.
JMeter stores test plans, threads, responses, variables, and listeners in memory. All of this lives in heap memory. When heap fills up, the JVM decides what data is no longer needed.
That cleanup process is garbage collection.
JMeter itself does not manage memory directly. The JVM does. This is why memory tuning always happens at the JVM level, not inside JMeter menus.
What Is Garbage Collection in Java?
Garbage collection is how Java frees memory that is no longer in use. Objects get created during test execution. When those objects are no longer referenced, the JVM removes them from memory.
This process is automatic. You cannot manually trigger garbage collection in a safe or reliable way. Calling forced cleanup methods is not recommended and often makes things worse.
For JMeter, this means one thing. You guide garbage collection behavior through JVM settings, not through JMeter actions.
Why Garbage Collection Is Important for JMeter Tests?
During load testing, JMeter creates a lot of objects very quickly. Threads start. Samplers run. Responses get stored. Variables change.
If garbage collection runs too often or too slowly, problems appear:
- Test execution slows down
- Response times become unstable
- Throughput drops
- JMeter freezes or crashes
- OutOfMemoryError appears
These issues do not mean your test logic is wrong. They usually mean memory pressure is too high or heap size is poorly set.
Things Required Before Performing Garbage Collection Tuning
Before you change any memory settings, stop and check a few basics:
- Java version used by JMeter
- Total RAM available on the machine
- Test plan size and number of threads
- Use of heavy listeners
- Whether JMeter runs in GUI or Non-GUI Mode
- Access to JVM startup options
Without this information, tuning becomes guesswork. Guessing leads to unstable tests.
How to Perform Garbage Collection in JMeter?
You do not perform garbage collection directly. You configure how the JVM handles it.
Start by setting heap size. This controls how much memory JMeter can use. Heap settings are passed as JVM options when JMeter starts.
Next, choose a garbage collector supported by your Java version. The JVM uses this collector to clean memory during runtime.
Apply these settings in JMeter startup files or command-line options. This ensures the JVM starts with the right memory rules from the beginning.
Avoid forcing garbage collection manually. It interrupts execution and often increases pause time. Let the JVM manage memory using the settings you provide.
How to Monitor Garbage Collection Behavior?
After tuning, you need visibility.
Enable GC Logs to see when and how memory cleanup happens. These logs show heap usage and pause times.
You can also observe memory in real time using tools like VisualVM or JConsole. These tools attach to the JVM and show heap growth and cleanup cycles.
If heap keeps growing without dropping, that may point to a memory leak or heavy listeners holding data.
Best Practices to Reduce Garbage Collection Issues
Here are practical habits that help memory stay stable during JMeter runs:
- Run load tests in Non-GUI mode
- Disable listeners during execution
- Store results to files, not memory
- Use realistic thread counts
- Avoid saving full response bodies
- Clean unused variables
- Split long tests into smaller runs
- Monitor heap usage during tests
- Use stable Java versions
These steps reduce object creation and memory pressure. Less pressure means smoother garbage collection.
Conclusion
Garbage collection in JMeter is not something you trigger. It is something you guide. Since JMeter runs on the Java Virtual Machine, memory behavior depends on JVM configuration and test design.
When heap size is correct and tests are clean, garbage collection stays quiet. When memory is mismanaged, GC becomes loud and disruptive.
Focus on good setup. Watch memory behavior. Fix small issues early.
If this article helped you, share it with others running JMeter tests. Leave a comment with your experience or questions.